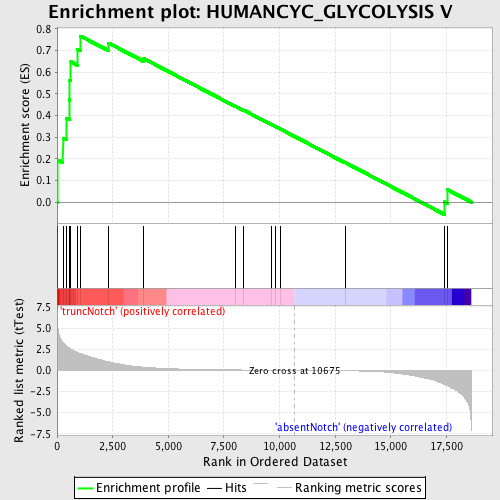
Profile of the Running ES Score & Positions of GeneSet Members on the Rank Ordered List
| Dataset | Set_03_absentNotch_versus_truncNotch.phenotype_absentNotch_versus_truncNotch.cls #truncNotch_versus_absentNotch |
| Phenotype | phenotype_absentNotch_versus_truncNotch.cls#truncNotch_versus_absentNotch |
| Upregulated in class | truncNotch |
| GeneSet | HUMANCYC_GLYCOLYSIS V |
| Enrichment Score (ES) | 0.7670484 |
| Normalized Enrichment Score (NES) | 1.5377451 |
| Nominal p-value | 0.012635379 |
| FDR q-value | 0.34152523 |
| FWER p-Value | 0.997 |
| PROBE | DESCRIPTION (from dataset) | GENE SYMBOL | GENE_TITLE | RANK IN GENE LIST | RANK METRIC SCORE | RUNNING ES | CORE ENRICHMENT | |
|---|---|---|---|---|---|---|---|---|
| 1 | ALDOA | 6290672 | 20 | 5.593 | 0.1939 | Yes | ||
| 2 | ENO3 | 5270136 | 264 | 3.305 | 0.2961 | Yes | ||
| 3 | TPI1 | 1500215 2100154 | 432 | 2.852 | 0.3866 | Yes | ||
| 4 | PGAM2 | 3610605 | 551 | 2.637 | 0.4722 | Yes | ||
| 5 | PGAM1 | 2570133 | 568 | 2.619 | 0.5626 | Yes | ||
| 6 | ENO1 | 5340128 | 621 | 2.530 | 0.6480 | Yes | ||
| 7 | PFKL | 6200167 | 911 | 2.120 | 0.7064 | Yes | ||
| 8 | PGK1 | 1570494 630300 | 1055 | 1.960 | 0.7670 | Yes | ||
| 9 | PFKP | 70138 6760040 1170278 | 2309 | 1.017 | 0.7351 | No | ||
| 10 | GAPDHS | 2690463 | 3886 | 0.376 | 0.6635 | No | ||
| 11 | ALDOC | 450121 610427 | 8021 | 0.050 | 0.4430 | No | ||
| 12 | PGK2 | 2650091 | 8391 | 0.041 | 0.4246 | No | ||
| 13 | BPGM | 5080520 | 9655 | 0.017 | 0.3573 | No | ||
| 14 | ENO2 | 2320068 | 9796 | 0.015 | 0.3503 | No | ||
| 15 | ALDOB | 4730324 | 10059 | 0.010 | 0.3365 | No | ||
| 16 | PKLR | 1170400 2470114 | 12953 | -0.050 | 0.1827 | No | ||
| 17 | PFKM | 1990156 5720168 | 17413 | -1.664 | 0.0010 | No | ||
| 18 | PKM2 | 6520403 70500 | 17558 | -1.826 | 0.0569 | No |

